How to plot multiple functions on the same figure using Matplotlib
Follow the next steps if you want to plot multiple graphs on the same figure, using matplotlib in Python.
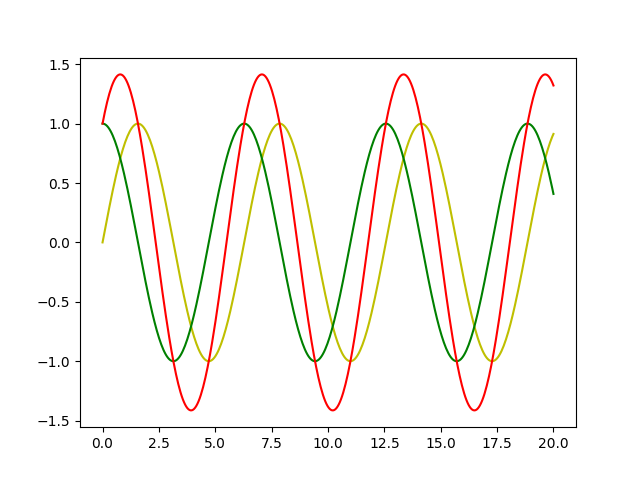
I will use 3 functions (sinus, cosinus and the addition), on the domain d, to demonstrate how to plot them in the same figure.
# Import pyplot module. This module will be used to generate the plot
import matplotlib.pyplot as plt

# Import some modules that will help to generate the demonstration data and functions
from numpy import linspace, sin, cos

d = linspace(0, 20, 400)
a = sin(d)
b = cos(d)
c = a + b

# plot each function, separately
plt.plot(d, a, 'y') # plot d, a separately
plt.plot(d, b, 'g') # plot d, b separately
plt.plot(d, c, 'r') # plot d, c separately

# show the figure
plt.show()
The result:
Alternatively, you can use a for loop:
# Using a for loop
for func in [a, b, c]:
plt.plot(d,func)

plt.show()
Or, if the functions you have to plot are not too many, you can do it in one line:
# One line command
plt.plot(d, a, d, b, d, c)

plt.show()
The resulted plot will be the same.